Testing the Difference in Typing Speeds Between Two Keyboards
Introduction

So I recently bought Logitech’s G915 wireless keyboard because I wanted a good wireless programming keyboard to go with my new monitor, and this keyboard has been hyped to be one of the best keyboards for programming (Cleus, Tech Lead, RTINGS) and ranked as the #1 wireless keyboard for productivity by Top 10.
Ever since I switched from my laptop keyboard to the Logitech G915 keyboard, I feel like there is a notable difference in my typing speed, so I decided to test this statistically.
Gathering the Data
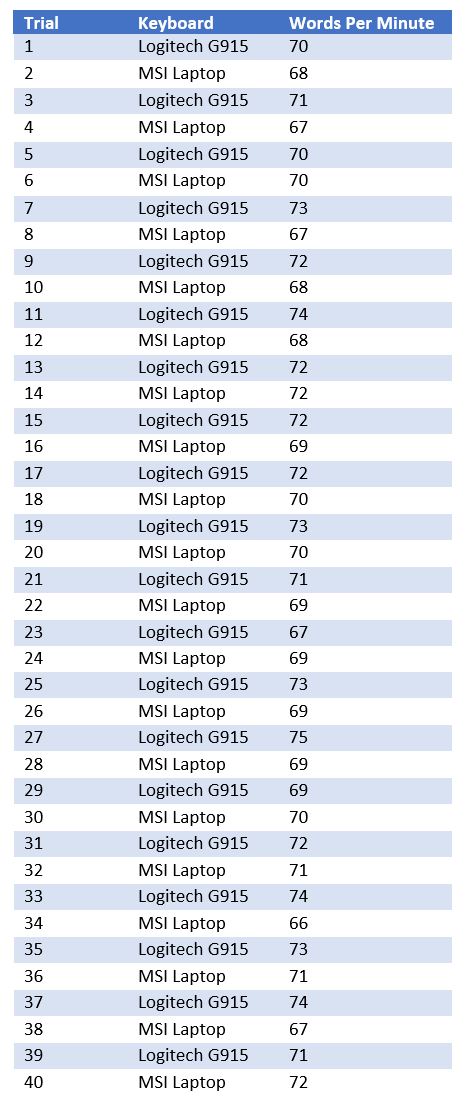
I set aside some time to take a grand total of 40 typing tests throughout the day, 20 for both keyboards (spaced out to give my fingers some rest). For each trial, I did a one minute sentences typing test using typingtest. To prevent any bias in the data collection, I alternated between my G915 and laptop. The results of the trials are displayed in a table below.
Let’s load this data into a pandas DataFrame WPM.
import pandas as pd
WPM = pd.DataFrame(
    data={
        'G915': [70, 71, 70, 73, 72, 74, 72, 72, 72, 73, 71, 67, 73, 75, 69, 72, 74, 73, 74, 71],
        'laptop': [68, 67, 70, 67, 68, 68, 72, 69, 70, 70, 69, 69, 69, 69, 70, 71, 66, 71, 67, 72]
        }
        )
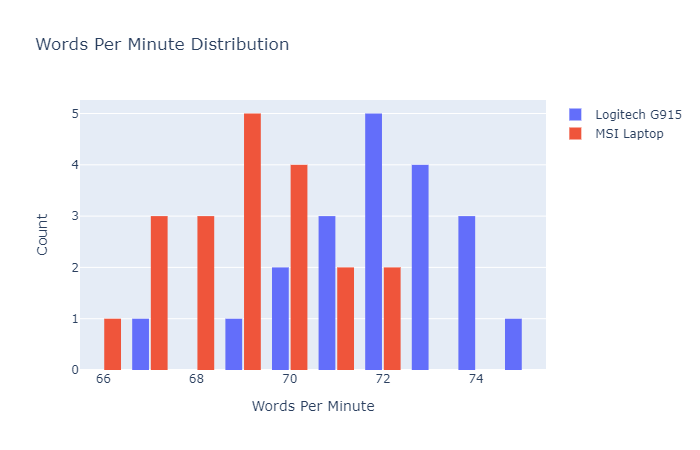
Here is a distribution of both samples generated using plotly.
import plotly.graph_objects as go
fig = go.Figure()
fig.add_trace(go.Histogram(x=WPM['G915'], name='Logitech G915', xbins=dict(size=1)))
fig.add_trace(go.Histogram(x=WPM['laptop'], name='MSI Laptop', xbins=dict(size=1)))
fig.update_layout(title_text='Words Per Minute Distribution',
                  xaxis_title_text='Words Per Minute',
                  yaxis_title_text='Count',
                  bargap=0.2,
                  bargroupgap=0.1)
fig.show()
Which Hypothesis Test do I Choose?
There are many statistical tests, so which one applies best for this application? There are a few important considerations to make.
- Are the samples normally distributed?
- What is the sample size?
- What kind of comparison will answer the problem statement?
- Are the samples independent?
The sample size is small (N = 20), I want to see if there is a statistically significant difference in sample means, and the samples are not independent since the measurement (words per minute) is taken on the same subject (me) for two different conditions (G915 vs. laptop). Given this information, the hypothesis test that makes the most sense is the paired sample t-test, but this only works if the samples are normally distributed (Central Limit Theorem does not apply since N < 30). A non-parametric alternative is the Wilcoxon signed-rank test. A non-parametric test is one that doesn’t assume the data fits a specific distribution type (normal in this case).
To test for normality, I will use the Shapiro-Wilk test which tests the null hypothesis that the data is sampled from a normal distribution.
from scipy.stats import shapiro
shapiro_test = shapiro(WPM['G915'])
print('Shapiro-Wilk Test Statistic for G915:', shapiro_test[0])
print('Shapiro-Wilk Test P-Value for G915:', shapiro_test[1])
shapiro_test = shapiro(WPM['laptop'])
print('Shapiro-Wilk Test Statistic for laptop:', shapiro_test[0])
print('Shapiro-Wilk Test P-Value for laptop:', shapiro_test[1])
Shapiro-Wilk Test Statistic for G915: 0.9469935297966003
Shapiro-Wilk Test P-Value for G915: 0.32374611496925354
Shapiro-Wilk Test Statistic for laptop: 0.9591456651687622
Shapiro-Wilk Test P-Value for laptop: 0.5269261002540588
Since the P-values are much higher than the significance level, 0.05, I retain the null hypothesis of normality. The best test is therefore the paired sample t-test!
Formulate the Hypotheses
Now that I have decided on the paired sample t-test, I can define the null and alternative hypotheses.
- Null Hypothesis: The mean difference between sample laptop and sample G915 is equal to zero.
- Alternative Hypothesis: The mean difference between sample laptop and sample G915 is not equal to zero.
The significance level for this test will be 0.05, so if the P-value is less than 0.05, I can reject the null hypothesis.
Perform a Paired Sample t-Test
I will use the ttest_rel from SciPy’s stats package.
from scipy.stats import ttest_rel as paired_ttest
t_stat, p_val = paired_ttest(WPM['G915'], WPM['laptop'])
print('t-statistic:', t_stat)
print('P-Value:', p_val)
t-statistic: 4.409815777991463
P-Value: 0.0003009267702446885
Interpreting Results
The P-value from the paired samples t-test is 0.0003, which indicates that if the null hypothesis were true (samples means are equivalent), there would be a 0.03% probability of obtaining a t-statistic of 4.4 or greater, which is much less than the signficance level of 5%. Since the odds of obtaining this t-statistic for two mean-equivalent samples is so low, I can reject the null hypothesis and accept the alternative hypothesis that there is a statistically significant difference between my typing speeds on the laptop keyboard and the G915 keyboard. SciPy’s paired sample t-test is two-tailed, so the P-value accounts for differences in both directions. However, it is obvious from the distribution plot that the typing speeds with Logitech’s G915 is higher, not lower.
Conclusion
So, based on robust statistical testing, I can confidently say that I type faster on the Logitech G915 keyboard compared to my old laptop keyboard. As for the actual cause of this, I don’t know. All the paired sample t-test tells me is that there is a difference. I suspect it is the G915’s mechanical build, with low travel distance, low key push force, tactile feedback, and optimal distance between keys. Or maybe it is the cool lighting effects. Who knows?